Copyright
Preface
Editorial Board and Staff
New Statistical Yearbooks Published by China Statistics Press
Statistical Chart
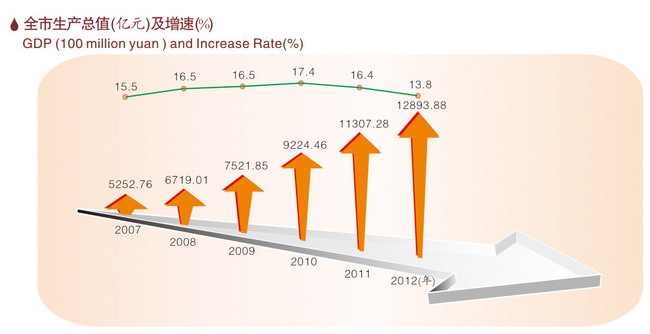
GDP (100 million yuan) and Increase Rate (%)
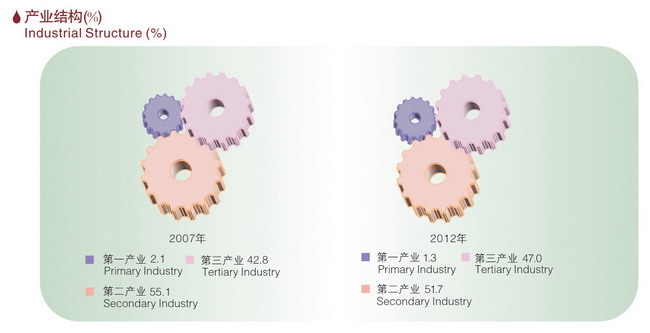
Industrial Structure (%)
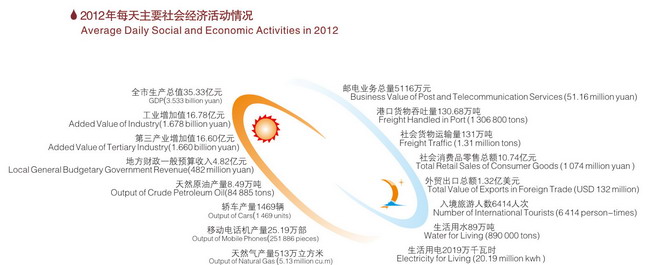
Average Daily Social and Economic Activities in 2012
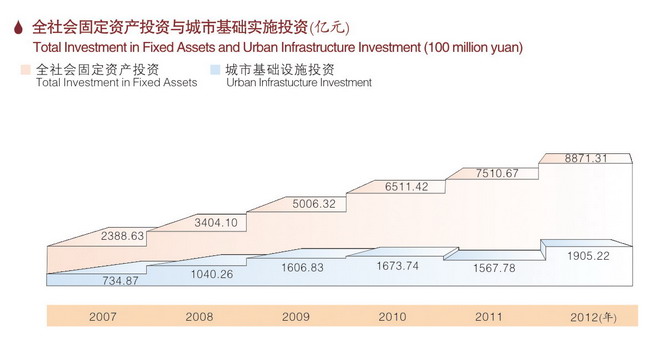
Total Investment in Fixed Assets and Urban Infrastructure Investment (100 million yuan)
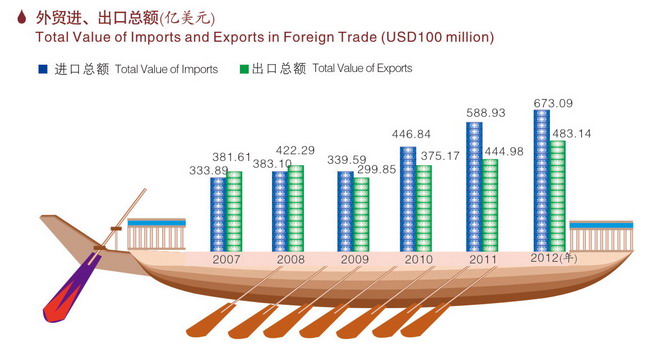
Total Value of Imports and Exports in Foreign Trade (USD 100 million)
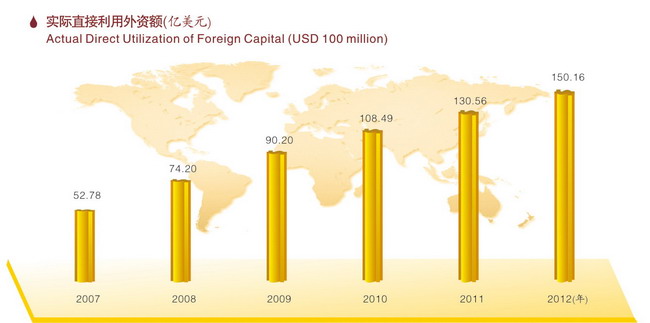
Actual Direct Utilization of Foreign Capital (USD 100 million)
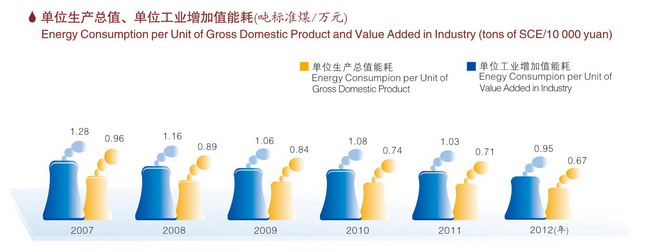
Energy Consumption per Unit of Gross Domestic Product and Value Added in industry (tons of SCE/10000 yuan)
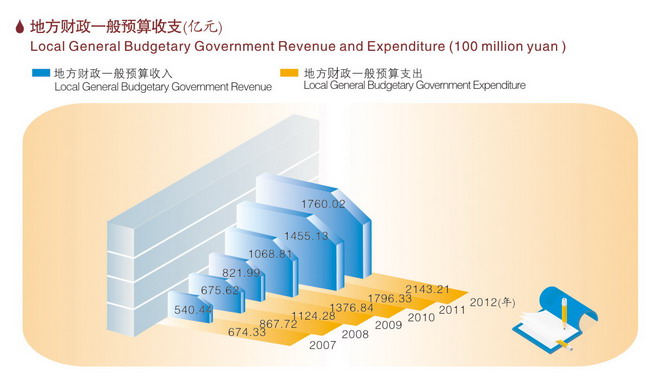
Local General Budgetary Government Revenue and Expenditure (100 million yuan)
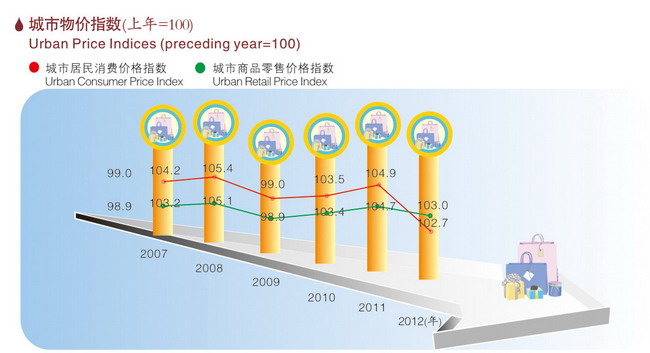
Urban Price Indices (preceding year=100)
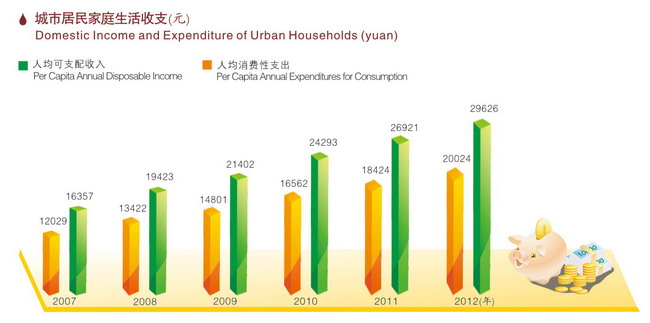
Domestic Income and Expenditure of Urban Households (yuan)
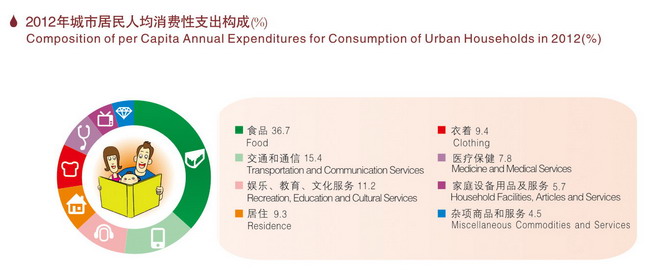
Composition of per Capita Annual Expenditures for Consumption of Urban Households in 2012 (%)
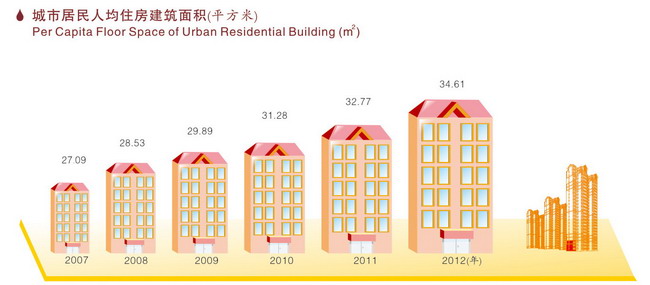
Per Capita Floor Space of Urban Residential Building (m2)
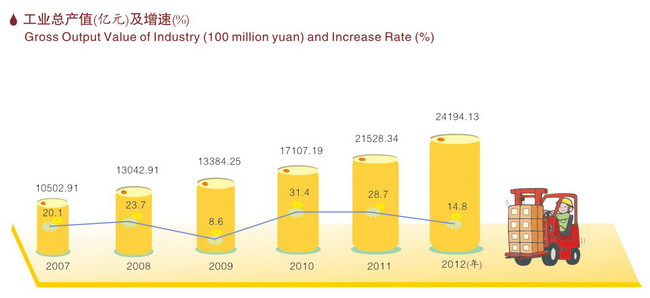
Gross Output Value of Industry (100 million yuan) and Increase Rate (%)
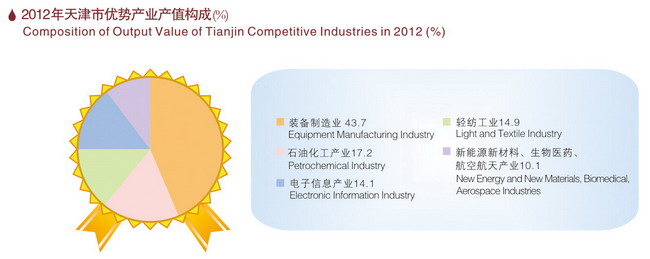
Composition of Output Value of Tianjin Competitive Industries in 2012 (%)
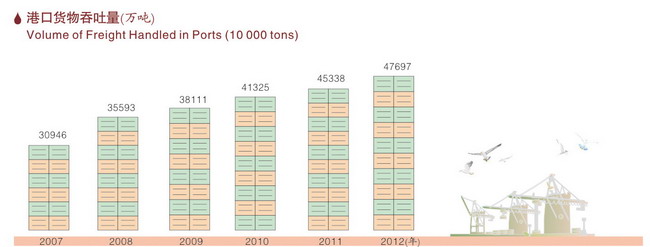
Volume of Freight Handled in Ports (10000 tons)
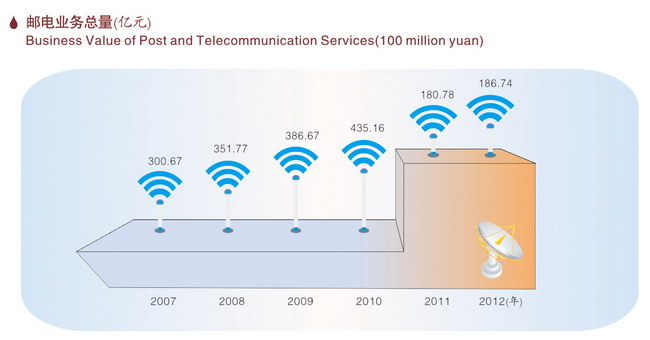
Business Value of Post and Telecommunication Services (100 million yuan)
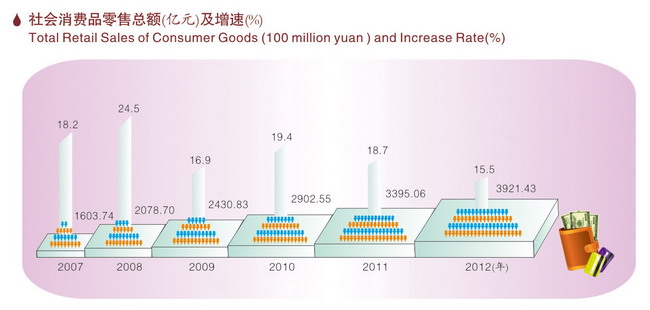
Total Retail Sales of Consumer Goods (100 million yuan) and Increase Rate (%)
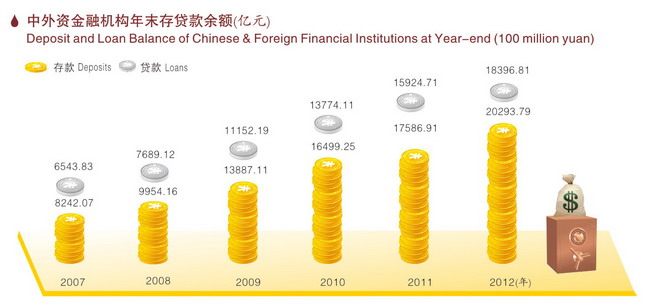
Deposit and Loan Balance of Chinese & Foreign Financial Institutions at Year-end (100 million yuan)
Statistical Communique
Statistical Communique on the 2012 National Economic and Social Development of Tianjin
Analysis of Tianjin Economic Situation 2012
Tianjin Social Development Report 2012
Chapter 1 General Survey
Administrative Divisions, End of 2012
Area of Land, 2011
Meteorological Data of Each Month, 2012
Meteorological Data by District and County, 2012
Number of Judicial Entities and Establishments, End of 2012 (Grouped by Registered Type)
Number of Judicial Entities, End of 2012 (Grouped by Sector)
Main Indicators and Increase Rate of National Economy in Main Years
Main Indicators and Increase Rate of National Economy in Main Years Continued 1
Main Indicators and Increase Rate of National Economy in Main Years Continued 2
Main Indicators and Increase Rate of National Economy in Main Years Continued 3
Main Indicators and Increase Rate of National Economy in Main Years Continued 4
Main Indicators and Increase Rate of National Economy in Main Years Continued 5
Main Indicators and Increase Rate of National Economy in Main Years Continued 6
Structural Indicators of National Economy and Social Development, 2008-2012
Main Indicators of Proportion and Benefit in National Economy and Social Development, 2009-2012
Average Daily Social and Economic Activities, 2009-2012
Per Capita Annual Level of Main Indicators of National Economy, 2009-2012
Position of Tianjin in the Whole Nation
Explanatory Notes on Main Statistical Indicators
Chapter 2 National Accounts
Gross Domestic Product, 1978-2012
Composition of Gross Domestic Product, 1978-2012
Indices of Gross Domestic Product, 1978-2012
Indices of Gross Domestic Product, 1979-2012
Gross Domestic Product by Industry, 2010-2012
Indices of Gross Domestic Product by Industry, 2010-2012
Share of the Contributions of the Three Strata of Industry to the Increase of GDP, 1995-2012
Contribution of the Three Strata of Industry to GDP Growth, 1995-2012
Components of Gross Domestic Product, 1978-2012
Gross Domestic Product by Expenditure Approach, 1978-2012
Final Consumption Expenditures and Composition, 1978-2012
Final Consumption Indices, 1979-2012
Final Consumption Expenditures, 2009-2012
Gross Capital Formation and Indices, 1978-2012
Share and Contribution of Final Consumption Expenditures and Gross Capital Formation to GDP Growth, 1978-2012
Households Consumption, 1978-2012
Explanatory Notes on Main Statistical Indicators
Chapter 3 Population
Main Statistics on Population, 1996-2012
Composition of Registered Population and Household Size, 1996-2012
Registered Households, Population and Population Density by Region
Registered Households by Registered Character
Registered Population by Registered Character
Registered Population by Sex
Registered Population by Age Groups, 2012
Main Statistics on Permanent Population, 2010-2012
Permanent Population by Region, 2012
Education Status of Population Aged 6 and over by Age, 2012
Marriage Status of Population Aged 15 and over by Age, 2012
Family Households by Size and Region, 2012
Households with Population Aged 65 and over by Region, 2012
Family Planning, 2009-2012
Marriage Registration, 2009-2012
Explanatory Notes on Main Statistical Indicators
Chapter 4 Employment and Remuneration
Total Employment Personnel, 1996-2012
Employment Personnel in Urban Non-private Units, 1996-2012
Employment Personnel Grouped by Sector, 2012
Number and Composition of Employment Personnel
Number and Composition of Employment Personnel in Urban Non-Private Units
Number and Composition of On-post Staff and Workers in Urban Non-Private Units
Number and Composition of Other Employment Personnel in Urban Non-Private Units
Basic Statistics on Registered Unemployed Personnel in Urban Area, 2008-2012
Statistics on Newly Increased Employment, 2009-2012
Statistics on Vocational Skill Training and Employment Service, 2008-2012
Total Remuneration of Employment Personnel in Urban Non-Private Units, 1996-2012
Average Remuneration of Employment Personnel in Urban Non-Private Units, 1996-2012
Total Remuneration of Employment Personnel in Urban Non-Private Units
Average Remuneration of Employment Personnel in Urban Non-Private Units
Total Remuneration of On-post Staff and Workers in Urban Non-Private Units
Average Remuneration of On-post Staff and Workers in Urban Non-Private Units
Total Remuneration of Other Employment Personnel in Urban Non-Private Units
Average Remuneration of Other Employment Personnel in Urban Non-Private Units
Number of Employment Personnel and Remuneratioin in Private Units, 2012
Explanatory Notes on Main Statistical Indicators
Chapter 5 Investment in Fixed Assets and Real Estate
Total Investment in Fixed Assets in Main Years
Total Investment in Fixed Assets and Newly Increased Fixed Assets by Rural and Urban Area, 1996-2012
Total Investment in Fixed Assets by Sector, 2012
Total Investment in Newly Increased Fixed Assets by Sector, 2012
Investment in Fixed Assets and Newly Increased Fixed Assets in Urban Area
Investment in Fixed Assets in Urban Area by Sector, 2012
Investment in Fixed Assets in Urban Area of Manufacturing, 2012
Newly Increased Fixed Assets in Urban Area by Sector, 2012
Newly Increased Fixed Assets in Urban Area of Manufacturing, 2012
Investment in Fixed Assets in Urban Area of Energy Industry, 2012
Urban Infrastructure Investment in Fixed Assets, 2012
Source of Funds for Investment in Fixed Assets in Urban Area by Sector, 2012
Floor Space of Buildings under Construction and Completed
Source of Funds for Investment in Fixed Assets in Urban Area
Number of Investment Projects under Construction in Fixed Assets in Urban Area by Sector, 2012
Number of Investment Projects in Fixed Assets Completed and Put into Use in Urban Are by Sector, 2012
Local Investment in Fixed Assets in Urban Area, 2012
Investment and Construction of Real Estate Development in Urban Area, 1996-2012
Investment in Real Estate Development
Construction of Real Estate Development
Basic Statistics on Real Estate Sales
Basic Statistics on Real Estate Property Management, 2010-2012
Total Investment in Fixed Assets of Non-agricultural Households in Rural Area
Total Investment in Fixed Assets of Agricultural Households in Rural Area
Basic Statistics on Key Projects, 2012
Main Newly Increased Production Capacity of Construction Projects, 2012
Explanatory Notes on Main Statistical Indicators
Chapter 6 Foreign Trade, Economic Cooperation and Tourism
Total Value of Imports and Exports in Foreign Trade, 1996-2012
Total Value of Imports and Exports in Tianjin Port, 1996-2012
Utilization of Foreign Capital, 1996-2012
Reference Exchange Rate of RMB (Period Average), 1981-2012
Total Value of Imports and Exports in Foreign Trade, 2012
Total Value of Imports and Exports in Foreign Trade by Country (Region), 2012
Inspection of Imports and Exports Commodities in Tianjin Port, 2008-2012
Municipal Overseas Enterprises and Agencies
Utilization of Foreign Direct Investment, 2010-2012
Foreign Capital Actually Used, 2010-2012
Borrowing Foreign Capital
Investment of Foreign-funded and Hong Kong, Macao and Taiwan Funded Enterprises, 2012
Number of International Tourists and Dwelling Days, 2009-2012
Foreign Exchange Earning from International Tourists, 2009-2012
List of Foreign Sister Cities with Tianjin
Economic Cooperation with Foreign Countries or Regions,2010-2012
Contracted Foreign Projects and Labour Cooperation by Country (Region), 2012
Statistics on Service Outsourcing
Explanatory Notes on Main Statistical Indicators
Chapter 7 Energy Production and Consumption
Total Production of Energy and Its Composition, 1996-2012
Final Consumption of Energy, 1996-2012
Overall Energy Balance Sheet (Standard Equivalent)
Basic Statistics on Energy Consumption, 1996-2012
Electricity Balance Sheet, 2008-2012
Elasticity of Energy Consumption, 1996-2012
Energy Consumption, 2008-2012
Energy Consumption for Non-production Purpose, 2009-2012
Annual per Capita Energy Consumption for Non-production Purpose, 1996-2012
The Final Consumption of Main Energy by Industrial Sector, 2012
Explanatory Notes on Main Statistical Indicators
Chapter 8 Government Finance
Local General Budgetary Government Revenue & Expenditure, 1996-2012
Government Revenue
Government Expenditure
General Budgetary Government Revenue at District & County Level, 2012
General Budgetary Government Expenditure at District & County Level, 2012
Tax Revenue of Tianjin National Tax Bureau, 2009-2012
Explanatory Notes on Main Statistical Indicators
Chapter 9 Price Indices
Urban General Price Indices, 1978-2012
Urban Consumer Price Indices by Category, 2009-2012
Urban Retail Price Indices by Category, 2009-2012
Producer Price Indices of Industrial Ex-factory Products, 2009-2012
Producer Price Indices of Industrial Ex-factory Products by Sector, 2009-2012
Producer Price Indices of Industrial Purchase, 2009-2012
Price Indices of Investment in Fixed Assets, 2009-2012
Selling Price Indices of Houses, 2012
Indices of Monetary Purchasing Power of Residents, 1991-2012
Explanatory Notes on Main Statistical Indicators
Chapter 10 People's Living Conditions
Improvement in Urban and Rural Households' Material and Cultural Life, 2009-2012
Per Capita Income & Expenditures and Increase Rate of Urban Households, 1996-2012
Basic Statistics on Urban Households, 1996-2012
Basic Statistics on Urban Households of Different Income Level, 2012 (Grouped by Annual per Capita Disposable Income)
Per Capita Income & Expenditures of Urban Households and Composition, 2009-2012
Per Capita Consumption Expenditures of Urban Households and Composition, 2009-2012
Classification of per Capita Annual Consumption Expenditures of Urban Households, 2012
Per 100 Urban Households Year-end Possessions of Major Durable Consumer Goods, 2009-2012
Composition of Basic Living Condition of Urban Households, 2009-2012
Basic Statistics on Rural Households, 2009-2012
Education Level of Labours in Rural Households, 2009-2012
Per Capita Annual Disposable Income of Rural Households
Per Capita Annual Living Expenditures of Rural Households, 2009-2012
Composition of per Capita Living Expenditures of Rural Households, 2009-2012
Per 100 Rural Households Year-end Possessions of Durable Consumer Goods, 2008-2012
Per Capita Annual Consumption on Food of Rural Households, 2008-2012
Original Value of Productive Fixed Assets per Rural Household, 2009-2012
Possessions of Productive Fixed Assets per 100 Rural Households, 2009-2012
Explanatory Notes on Main Statistical Indicators
Chapter 11 Resources Environment and Public Facilities
City Construction Land, 2010-2012
Floor Space of Buildings in City, 2010-2012
Municipal Facilities in City, 2010-2012
Urban Tap Water, 2010-2012
Basic Statistics on Gas in City, 2010-2012
Heating in City, 2010-2012
Public Traffic in City, 2010-2012
Development of Urban Environmental Sanitation, 2010-2012
Parks, Gardens and Green Area in City, 2010-2012
Distribution of Parks, 2012
Water Resources, 2002-2012
Water Supply and Water Use, 2002-2012
Water, Atmospheric, Acoustic and Ecological Environment, 2010-2012
Utilization and Disposal of Industrial Waste Residue, 2010-2012
Composition of Environment Protection Personnel, 2010-2012
Implementation of Environmental Management on Construction Project, 2010-2012
Industrial Pollution Treatment Condition, 2010-2012
Explanatory Notes on Main Statistical Indicators
Chapter 12 Agriculture
Major Indicators of Rural Economy
Conditions of Agricultural Production, 1996-2012
Gross Output Value and Increase Rate of Farming, Forestry, Animal Husbandry and Fishery, 1996-2012
Structure of Gross Output Value of Farming, Forestry, Animal Husbandry and Fishery, 1996-2012
Sown Areas of Farm Crops, 1996-2012
Yield of Major Farm Crops, 1996-2012
Gross Output Value and Value-added of Farming, Forestry, Animal Husbandry and Fishery by District and County, 2012
Sown Areas of Major Farm Crops by District and County, 2012
Yield of Major Farm Crops by District and County, 2012
Production of Animal Husbandry by District and County, 2012
Forestry Production, Orchard Areas and Output, 2010-2012
Fishery Production by District and County, 2012
Large Reservoirs of Tianjin, 2012
Medium Reservoirs of Tianjin, 2012
Explanatory Notes on Main Statistical Indicators
Chapter 13 Industry
Gross Output Value and Increase Rate of Industry, 1996-2012
Gross Output Value of Industry above Designated Size
Gross Output Value of Local Industry above Designated Size
Production Capacity of Major Industrial Products
Output of Major Industrial Products, 1996-2012
Output of Major Industrial Products, 2012
Main Indicators on Economic Benefit of Industrial Enterprises by District and County, 2012
Main Economic Indicators of Industrial Enterprises above Designated Size, 1996-2012
Main Economic Indicators of Industrial Enterprises above Designated Size, 2012
Main Economic Indicators of Local Industrial Enterprises above Designated Size, 2012
Main Economic Indicators of Industrial Enterprises above Designated Size by Sector, 2012
Main Economic Indicators of Large and Medium-sized Industrial Enterprises, 2012
Main Economic Indicators of Large and Medium-sized Industrial Enterprises by Sector, 2012
Main Economic Indicators of Large and Medium-sized State-owned Industrial Enterprises by Sector, 2012
Main Economic Indicators of Small and Mini-sized Industrial Enterprises above Designated Size, 2012
Main Economic Indicators of Small and Mini-sized Industrial Enterprises above Designated Size by Sector, 2012
Main Economic Indicators of High & New Technology Industry, 2012
Main Economic Indicators of Competitive Industry, 2012
Main Indicators on Economic Benefit of Industrial Enterprises above Designated Size, 1996-2012
Main Indicators on Economic Benefit of Industrial Enterprises above Designated Size, 2012
Main Indicators on Economic Benefit of Industrial Enterprises above Designated Size by Sector, 2012
Main Economic Indicators of Large & Medium-sized Industrial Enterprises and as Percentage of Municipal Industry
Main Economic Indicators of Large & Medium-sized State-owned and State-holding Industrial Enterprises as Percentage of Municipal Industry
Explanatory Notes on Main Statistical Indicators
Chapter 14 Construction
Basic Statistics on Construction Enterprises, 1996-2012
Main Indicators of Economic Benefit and Engineering Quality of Construction Enterprises,1996-2012
Basic Statistics on Construction Enterprises (Grouped by Status of Registration and Ownership)
Basic Statistics on Construction Enterprises (Grouped by Sector and Qualification Grade)
Main Financial Indicators of Construction Enterprises, 2012
Total Capacity and Net Value of Machinery and Equipment Owned by Construction Enterprises (Year-end), 1996-2012
Value and Power of Machines per Labourer of Construction Enterprises, 1996-2012
Machinery & Equipment and Economic Benefit Indicators of Construction Enterprises
Building Construction of Construction Enterprises
Main Indicators of Subcontracted Construction Enterprises
Explanatory Notes on Main Statistical Indicators
Chapter 15 Transportation, Post and Telecommunication Services
Passenger & Freight Traffic and Turnover Volume of Passenger & Freight Traffic, 1996-2012
Passenger & Freight Traffic and Turnover Volume of Passenger & Freight Traffic, 2009-2012
Length of Transport Routes, 2009-2012
Volume of Passenger & Freight Handled in Ports, 1996-2012
Ports Facilities, 2010-2012
Volume of Freight Handled in Ports by Category
Main Technical and Economic Indicators of Highway and Civil Aviation Transport, 2010-2012
Main Indicators of Civil Aviation Airport, 2010-2012
Number of Civil Motor Vehicles Owned, 2012
Basic Statistics on Post and Telecommunication Services, 1996-2012
Basic Statistics on Post and Telecommunication Services, 2010-2012
Main Communication Capacity of Telecommunication Services, 2009-2012
Level of Post and Telecommunication Services, 2009-2012
Number of Post and Telecommunication Offices by Region, 2009-2012
Explanatory Notes on Main Statistical Indicators
Chapter 16 Wholesale and Retail Trade, Accommodation and Catering Services
Total Retail Sales of Consumer Goods, 1996-2012
Total Purchases, Sales and Inventory of Wholesale and Retail Trade above Designated Size, 1998-2012
Total Purchases of Wholesale and Retail Trade above Designated Size
Total Sales and Inventory of Wholesale and Retail Trade above Designated Size
Main Indicators of State-owned & State-holding Wholesale and Retail Trade above Designated Size, 2012
Basic Statistics on Accommodation Services above Designated Size, 2012
Basic Statistics on Catering Services Enterprises above Designated Size, 2012
Main Financial Indicators of Enterprises above Designated Size of Wholesale and Retail Trade by Status of Registration, 2012
Main Financial Indicators of Enterprises above Designated Size of Wholesale and Retail Trade by Sector, 2012
Basic Conditions of Chain Retail Enterprises, 2012
Statistics on Three, Four, Five-star Level Hotel by District and Country, 2012
Basic Conditions of Chain Catering Enterprises above Designated Size, 2012
Basic Statistics on Commodity Exchange Markets with Transaction Value over 100 Million Yuan, 2012
Domestic Capital Actually Used, 2008-2012
Domestic Capital from Other Provinces and Municipalities
Explanatory Notes on Main Statistical Indicators
Chapter 17 Financial Intermediation
Financial Institutions
RMB Deposit and Loan Balance of Chinese & Foreign Banking Institutions, 1981-2012
RMB Deposit and Loan Balance of Chinese Financial Institutions, 1981-2012
RMB & Foreign Deposit and Loan Balance of Chinese & Foreign Financial Institutions, 2007-2012
RMB & Foreign Currency Credit Funds Balance Sheet of Chinese & Foreign Financial Institutions
RMB Deposit and Loan Balance of Chinese & Foreign Financial Institutions
RMB Deposit and Loan Balance of Chinese Financial Institutions
Official Interest Rates on Deposits of Financial Institutions
Official Interest Rates on Loans of Financial Institutions
Total Amount of Personal Loans, 2009-2012
Number of IPO of Domestic Listed Companies, 1993-2012
Domestic List of IPO of Tianjin Enterprises, 1993-2012
Insurance Institutions
Main Indicators of Insurance Business, 1996-2012
Basic Statistics on Insurance Business
Head Offices and Branches of Foreign Investment (Joint Venture)Insurance Companies in Tianjin, 2012
Branches or Offices of Foreign Investment (Joint Venture)Banks in Tianjin, 2012
Explanatory Notes on Main Statistical Indicators
Chapter 18 Education, Science and Technology
Basic Statistics by Level and Type of School, 1996-2012
Schools, Students and Teachers by Level and Type of School
Number of Student Enrollment per 10 000 Persons, 2008-2012
The Ratio of Students to Teachers in ordinary Schools at all Levels, 2008-2012
Percentage of Graduate Students and Enrollment in All Schools by Level, 2008-2012
Number of Postgraduate Student and Instructors, 2008-2012
Number of Enrolled Postgraduate Students by Subject, 2010-2012
Basic Statistics on Institutions of Higher Education
Number of Students Enrollment in Institutions of Higher Education by Subject
Number of Full-time Teachers in Institutions of Higher Education (By Professional Title)
Basic Statistics on Secondary Vocational Education
Basic Statistics on Regular Secondary Schools, 2012
Basic Statistics on Kindergartens, 2009-2012
Distribution of Regular Secondary Schools and Primary Schools, 2012
Statistics on Schoolhouses in Regular Secondary Schools, Primary Schools and Kindergartens, 2012
Basic Statistics on Other Education, 2009-2012
Statistics on Network Education Students
Statistics on Foreign Students
Special Technical Personnel, 2010-2012
Composition of Special Technical Personnel, 2012
Composition of Special Technical Personnel of Natural Science, 2012 (Grouped by Sector)
Composition of Special Technical Personnel of Social Science, 2012 (Grouped by Sector)
Basic Statistics on Independent Institutions of Scientific Research and Technological Development
Projects and Input of Independent Institutions of Natural Science Research (Grouped by Type of Projects)
Patent Applications Examined and Granted
Achievements in Science and Technology, 2010-2012
List of National Scientific and Technological Prizes Awarded in Tianjin, 2012
Projects of Development and Input of Scientific Research in Universities and Colleges, 2012 (Science, Engineering, Agriculture and Medicine)
S&T Works and Papers in Universities and Colleges, 2009-2012 (Science, Engineering, Agriculture and Medicine)
Supervision of Special Equipment
Check and Administration on Quality & Technique, 2010-2012
Scientific and Technological Activities of Science and Technology Associations and Affiliated Institutions, 2012
Basic Statistics on Science and Technology and R&D Activities, 2012
S&T Activities in Industrial Enterprises above Designated Size, 2012
R&D Activities in Industrial Enterprises above Designated Size by Sector, 2012
Research Institutions and Patents of Industrial Enterprises above Designated Size by Sector, 2012
Research Institutions and Patents of Industrial Enterprises above Designated Size by Sector, 2012 Continued
Basic Statistics on Technology Market, 2012
Explanatory Notes on Main Statistical Indicators
Chapter 19 Public Health and Social Services
Statistics on Public Health, 1996-2012
Number of Health Care Institutions, 2009-2012
Statistics on Public Health, 2012
Number of Medical Technical Personnel, 2012
Number of Beds in Health Care Institutions, 2009-2012
Diagnosis, Treatment and Used Beds of Medical Institutions, 2009-2012
Operation of Hospitals, Health Care Centers
Basic Statistics on Community Health Care Centers
Basic Statistics on Village Health Room, 2009-2012
Basic Statistics on Maternity and Children Care, 2009-2012
Death Rate of Top 10 Diseases and Proportion
Total Expenditure on Health and Composition, 1996-2012
Composition of Total Expenditure on Health by Flow
Basic Statistics on Public Health Care Institution by District and County, 2012
Statistics on Social Welfare Institutions and Enterprises
Basic Statistics on Social Adoptive Welfare Institutions, 2012
Situation of Preferential Treatment Institutions, 2009-2012
Basic Statistics on Community Services Agencies
Basic Statistics on Social Relief, 2009-2012
Basic Statistics on Senile Citizen Undertakings, 2009-2012
Situation of Medical Aid, 2009-2012
Basic Statistics on Red Cross Society, 2010-2012
Explanatory Notes on Main Statistical Indicators
Chapter 20 Culture and Sports
Basic Statistics on Cultural Institutions and Personnel, 2004-2012
Books, Newspapers and Magazines Publication, 2010-2012
Publication of Books by Category, 2010-2012
Publication of Video Products, 2010-2012
Production of Broadcasting and Television, 2012
Programs of Broadcasting and Television, 2012
Statistics on Broadcasting and Television Stations, 2009-2012
Basic Statistics on Cable Television, 2009-2012
Basic Statistics on Film Projecting Units, 2009-2012
Basic Statistics on Art, 2009-2012
Statistics on Archives Institutions and Personnel, 2010-2012
Basic Statistics on Diversiform Archives, 2010-2012
Basic Statistics on Government and Institution Archives, 2010-2012
Basic Statistics on Enterprises Archives, 2010-2012
Basic Statistics on Public Libraries, 2009-2012
Basic Statistics on Museums and Cultural Relic Protection Units, 2009-2012
Basic Statistics on Mass Art, 2009-2012
Basic Statistics on Physical Work, 2009-2012
Number of Athletes and Referees in Grades, 2010-2012
Statistics on Medals Won in International & National Competitions, 2012
Explanatory Notes on Main Statistical Indicators
Chapter 21 Public Management and Others
Number and Sex Composition of Delegacy, Proposal and Suggestion by Tianjin Municipal People's Congress
Number of Delegacy, Proposal and Resolution Put on Record by Tianjin Political Consultative Conference
Statistics on Grassroots Unions, 2009-2012
Statistics on Women's Federation Organizations, 2009-2012
Basic Statistics on People's Mediation
Basic Statistics on Lawyers, 2009-2012
Basic Statistics on Notarization, 2010-2012
Statictics on The Legal Aid Work
Economic Cases under Investigation by Procuratorial Organs, 2012
Civil Cases Accepted & Settled by Courts, 2012
Administrative Cases Accepted and Settled by Courts, 2012
Basic Statistics on Social Security, 2010-2012
The Disposal of Labour Disputes, 2009-2012
Basic Statistics on Persons with Disabilities, 2012
Basic Statistics on Accepted Cases of Consumer Institution, 2012
Explanatory Notes on Main Statistical Indicators
Chapter 22 Basic Statistics on Districts and Counties
Basic Statistics on Districts and Counties, 2012
Basic Statistics on Heping District
Basic Statistics on Hedong District
Basic Statistics on Hexi District
Basic Statistics on Nankai District
Basic Statistics on Hebei District
Basic Statistics on Hongqiao District
Basic Statistics on Dongli District
Basic Statistics on Xiqing District
Basic Statistics on Jinnan District
Basic Statistics on Beichen District
Basic Statistics on Wuqing District
Basic Statistics on Baodi District
Basic Statistics on Binhai New Area
Basic Statistics on Ninghe County
Basic Statistics on Jinghai County
Basic Statistics on Jixian County
中文版
